

When Valuations, Margins, and AI All Look Extreme
History argues for caution, while artificial intelligence presents a compelling case that this market cycle could unfold differently than those that came before.

By Robert L. Koscik
It is not every day you get to watch the market argue with history this loudly.
For roughly the past year, and really longer than that, we have been living through a market packed with historical outliers. If you enjoy looking at markets through the lens of data, cycles, and precedent, this is a fascinating moment. If you are trying to allocate capital responsibly, it is also a humbling one.
Right now, several of the most important long-term market measures are stretched to levels that have rarely been seen before. At the same time, there is a real and reasonable argument that artificial intelligence could drive a meaningful wave of productivity, support margins, and change the earnings power of certain industries. That tension is what I want to focus on here.
Start with valuation: the Shiller P/E
The first chart worth looking at is the Shiller P/E.
Robert Shiller, the longtime Yale economist, built one of the most widely followed valuation tools in finance. The Shiller P/E is not useful because it tells us what the market will do next week or next month. It is useful because it gives us historical context. It helps us compare today’s market to other periods when investors were paying very high prices for earnings.
What that context says today is fairly straightforward: by this measure, the U.S. stock market is trading near some of the most expensive levels in history. When markets have reached similarly elevated levels in the past, forward returns have typically been much more muted than the returns investors had grown used to on the way up.
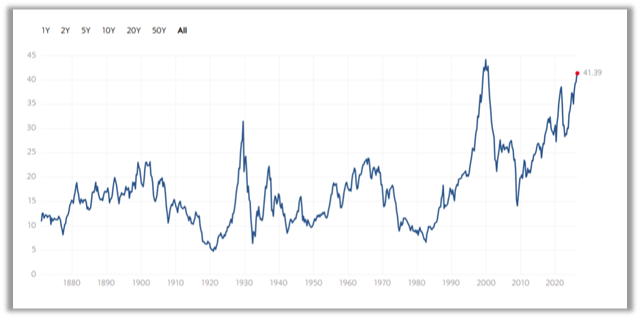
Source: https://www.multpl.com/shiller-pe
That does not tell us a crash is imminent. It does tell us expectations should probably be more disciplined from here.
The next valuation measure is even harder to ignore
If the Shiller P/E makes the market look expensive, price-to-sales looks even more extreme.
Price-to-sales is a metric I put a lot of weight on. I like it because sales are harder to manipulate than earnings, and it can be especially useful when identifying industries or companies where revenue trends are improving meaningfully before the rest of the market fully catches on.
At the index level, though, price-to-sales is sending a very loud message. Comparing the price of the S&P 500 to the combined sales of the companies inside the index suggests we are in the most richly valued market on record by that measure.
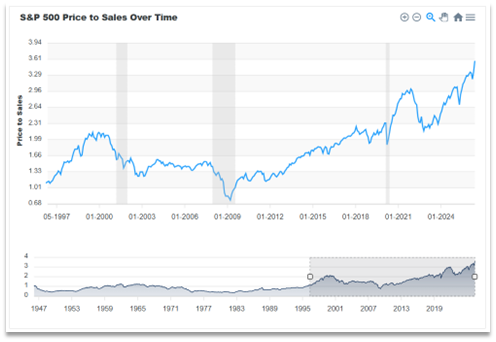
https://dqydj.com/sp-500-ps-ratio/
Again, expensive markets can stay expensive for longer than most expect. But history suggests that when investors are paying this much for each dollar of sales, future returns usually get harder to come by.
Profit margins may be the most important piece of the puzzle
Now let me get a little further into the weeds, because this may be one of the most important charts of all.
Many market historians and academics believe corporate profit margins are among the most mean-reverting data series in finance. In plain English, that means unusually high margins tend not to stay unusually high forever. Competition, wage pressure, input costs, regulation, and simple economic gravity have a way of pulling them back toward more normal levels over time.
Historically, something around 7% looked more normal. Over the past 20 years, we have spent a lot of time above that level. More recently, margins have moved well beyond that, settling above 11%, which is historically unusual.
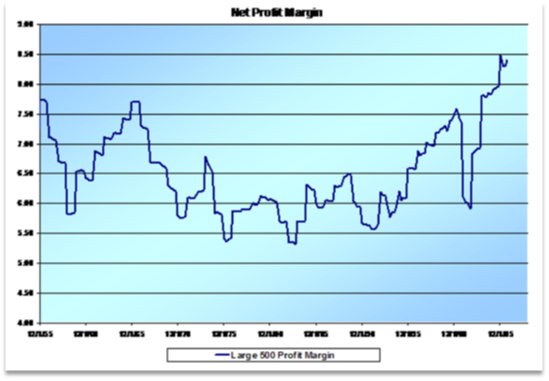
https://www.hussmanfunds.com/rsi/profitmargins.htm Note: The chart above represents Net Profit Margins from 1950-2005. Since 2005, this number has almost always been above 10% and of late, closer to 13%.
That matters because even a modest reversal in margins could have an outsized impact on earnings. If margins were to fall by even 2% to 4%, the drop in earnings could be substantial. It would not take a dramatic collapse to create a meaningful reset in profitability.
Some of today’s margin strength has come from a very real supply-and-demand imbalance. Certain chip companies, for example, have been operating in an environment where demand has far outpaced supply, and the pricing power has been enormous. That has been a gift for earnings, but investors should remember that semiconductors have historically been a boom-and-bust industry. When conditions are this good, it is easy to assume they stay this good. History usually says otherwise.
Earnings yield is another useful reality check
Another data point I keep coming back to is the earnings yield of the market.
When markets get expensive, earnings yield tends to fall. We saw it in 1929. We saw it in 1987. We saw it in 2000. And we can see it again today.
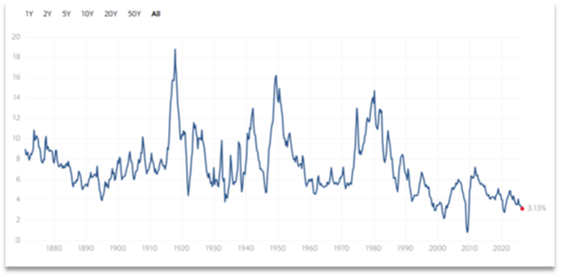
https://www.multpl.com/s-p-500-earnings-yield/table/by-year
Why does that matter? Because investors are always making relative decisions, even if they do not explicitly think of it that way. If I can earn 5% in a lower-risk instrument, while the earnings yield on the stock market is meaningfully lower, then the case for broad market exposure becomes less compelling on a historical risk-adjusted basis.
That does not mean stocks are uninvestable. It does mean selectivity matters more.
So what is the bullish case?
With all of that said, there is a real counterargument here, and it should not be dismissed.
The bullish case is productivity, and increasingly that means AI.
I have already seen this in my own day-to-day work. AI is improving efficiency, speeding up research, and helping surface useful insights faster and more accurately. That is not theoretical anymore. It is here now, and I suspect we are still early.
If AI meaningfully boosts productivity across the economy, a few things can happen:
- Margins could remain elevated longer than history would normally suggest.
- Production costs could fall, helping ease inflation pressure.
- The Federal Reserve could have more room to stabilize or lower rates if inflation remains contained.
- Certain sectors could see an outsized benefit as AI changes how work is done.
One of the clearest examples, in my view, is healthcare. AI has the potential to accelerate drug discovery, improve diagnostics, and support surgeons and medical staff with better tools and decision support. That is a powerful investment theme, especially in areas of the market that do not already look stretched.
Another area I continue to spend time researching is drone technology. In many settings, the next best thing to boots on the ground is a smart, scalable, lower-cost system that can gather information, reduce risk, and improve response times. I think that theme has staying power as well.
My takeaway
I do spend time thinking about whether I should be raising exposure to stocks or lowering it, but investing has never been a perfect science.
For me, the better question is not simply whether the market is expensive. It is where we are in the market and economic cycle, what history suggests from here, and which sectors or styles remain out of favor, reasonably priced, or positioned for stronger growth than the broader market expects.
That is where the opportunity is.
Today’s market is sending mixed messages. Valuations are elevated. Margins are historically stretched. Earnings yields are not especially comforting. But productivity gains from AI may be real enough to delay, soften, or reshape the normal rules of mean reversion.
That is why I remain cautious on the broad market, but still very interested in finding pockets of value, growth, and dislocation beneath the surface.
Disclosure: S&P 500 Index is a market index generally considered representative of the stock market as a whole. The index focuses on the large-cap segment of the U.S. equities market. Indices are unmanaged, and one cannot invest directly in an index. Past performance is not a guarantee of future results.